Flow Analysis Around NACA2412 Airfoil
MODULE
AIM
To investigate the aerodynamic characteristics of the NACA2412 airfoil, calculating lift, drag, and moment coefficients at various angles of attack for a comprehensive understanding of its performance.
QUICK PEEK INTO THE TEXTBOOK
Review the TEXTBOOK to refresh your understanding of basic concepts before advancing to more complex material.
1. FLOW ANALYSIS USING WIND TUNNEL
1. Select Default Streamlined Flow
- Navigate to Layer 3 in the menu.
- Click on “Wind Tunnel” to stick with the default streamlined fluid flow.
2. Load an Airfoil
- Move to Layer 4 in the menu.
- Select “LOAD > AIRFOIL” to load an airfoil shape of your choice.
3.View Velocity and Pressure Distributions
- Go to Layer 2 in the menu.
- Click “SPEED” to visualize the velocity distribution around the airfoil.
- Click “PRESSURE” to view the pressure distribution
- You can also explore two other options in Layer 2: “PARTICLE” and “SMOKE” for different visualizations.
For better SMOKE FLOW VISUALZATION
- To enhance the visibility of the smoke distribution, proceed to Layer 1.
- Click on “INSERT” to insert new flow field lines.
- Wait for the flow to stabilize.
Now, enjoy observing the captivating and beautiful fluid flow interactions around the airfoil. Have fun exploring the dynamics of this fascinating phenomenon!
1.1. RESULTS FROM WIND TUNNEL
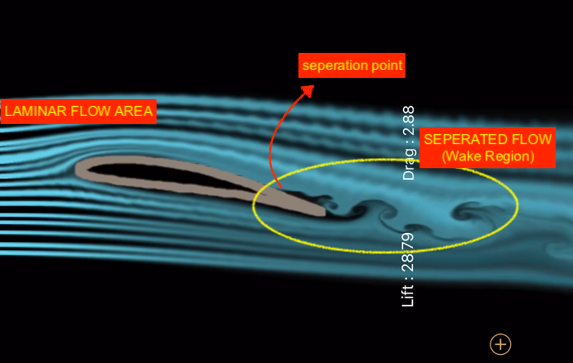
Smoke Streamlines
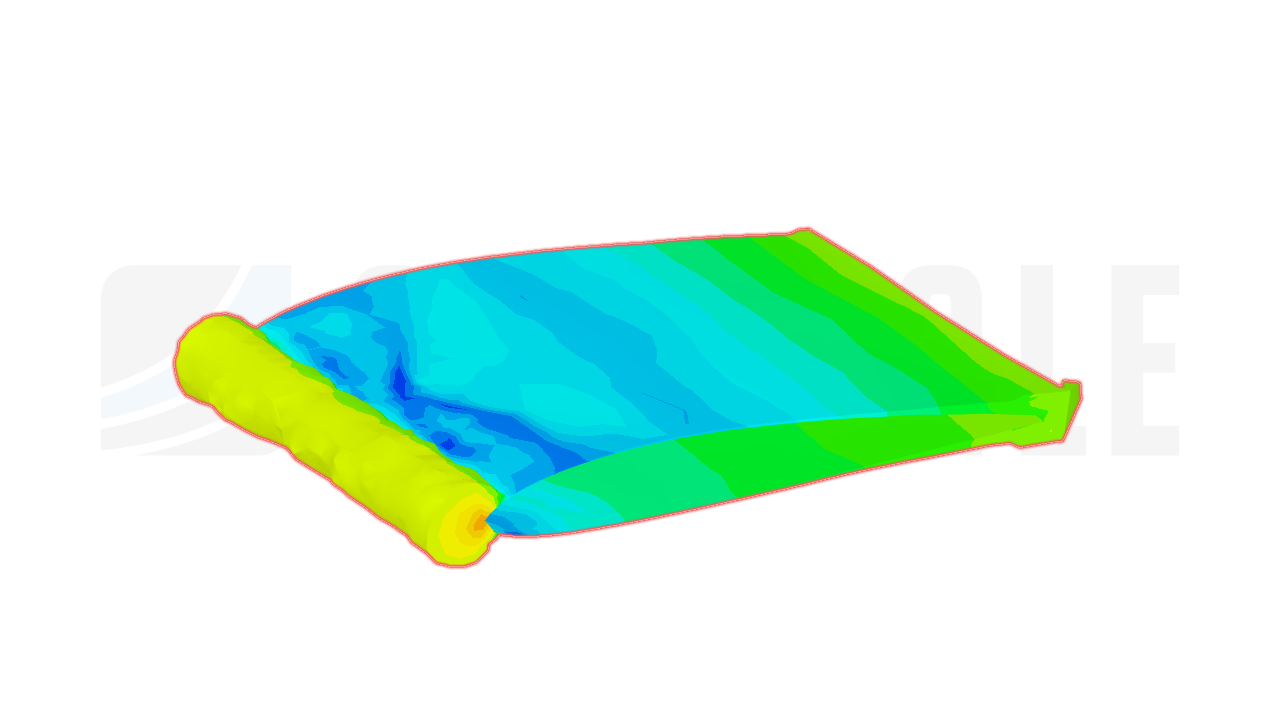
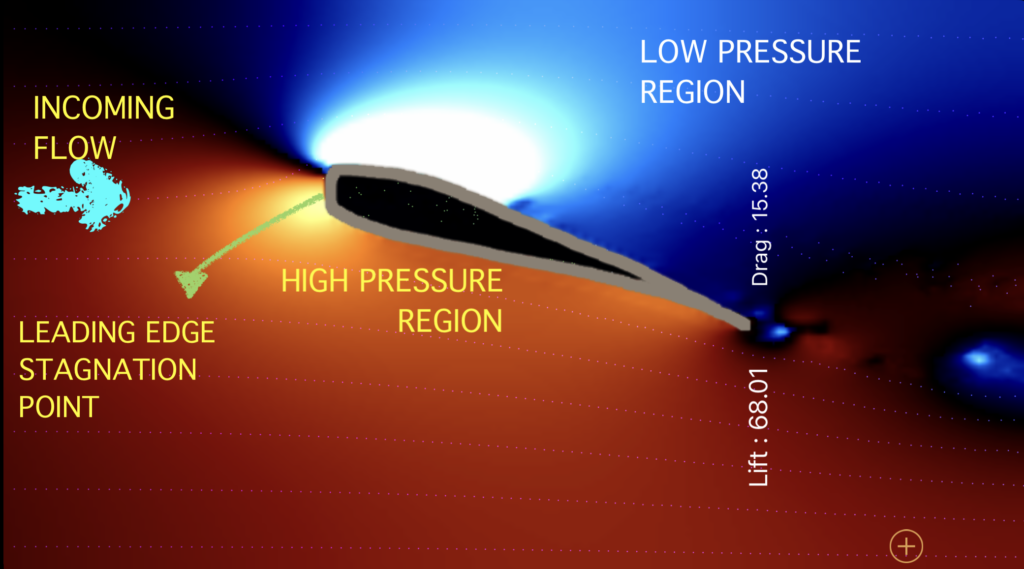
Pressure Distribution & Stagnation Point
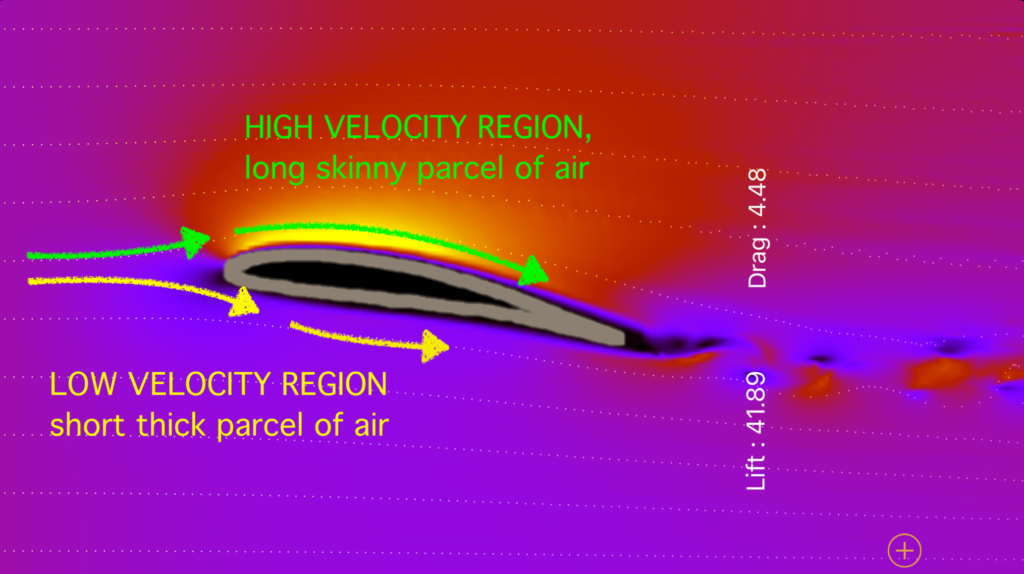
Velocity Distribution
2. FLOW ANALYSIS USING AIRFOIL DESIGN
FLOW SIMULATION SET-UP
- Inviscid, Incompressible, Incoming Flow
- Incoming Flow Velocity = 80 m/s (0.233 Mach)
- Mesh Type = O- Type
- Solver Type : Inviscid Compressible Euler
- Simulation Scheme : Runge Kutta Explicit
- Open the Airfoil Design App, and follow the instructions as given in the RECAP section with the renewed flow conditions.
- Click here to follow the step-by-step guide.
2.1. RESULTS FROM AIRFOIL DESIGN
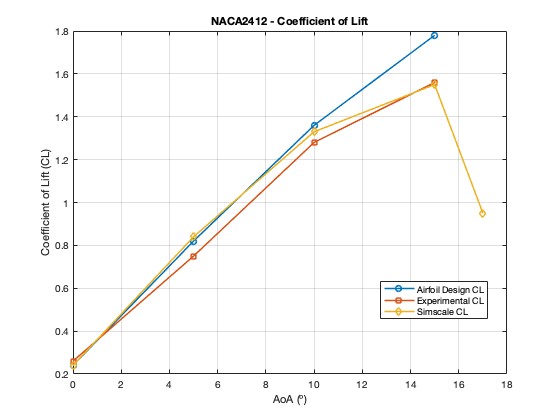
Lift Coefficients
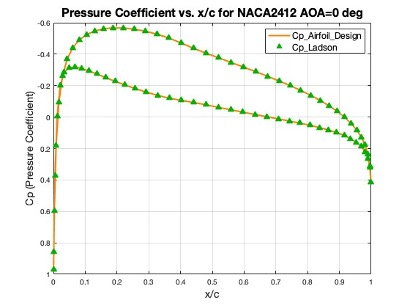
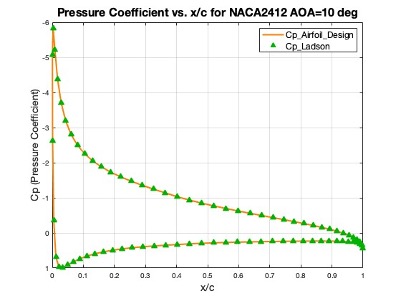
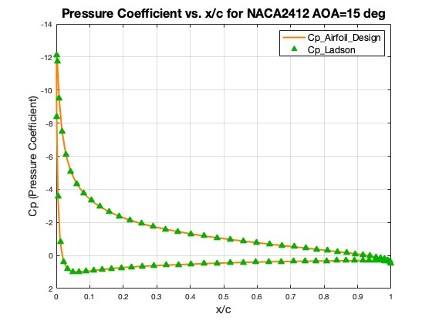
Pressure Coefficients
2.2. OBSERVATION & CONCLUSION FROM AIRFOIL DESIGN
OBSERVATION
- The Airfoil Design App accurately predicts coefficients of pressure and closely aligns with test data and NASA’s CFD codes for pressure distributions along the airfoil surface.
- We could find from the section 2.1 RESULTS, the lift and drag coefficient values exhibited a continuous increase until reaching what was anticipated as the stall point. However, contrary to expectations where Cl max and AOA max were anticipated to correspond to the stall point, this trend persisted beyond those values, clearly indicating that the obtained results are inaccurately predicted.
But WHY ?
The “Airfoil Design” app exhibits limitations in accurately predicting Cl (lift coefficient) vs. AOA (angle of attack) and Cd (drag coefficient) vs. AOA graphs due to its underlying methods, primarily the use of the “H-S Panel method” and the “inviscid compressible Euler solver.” as discussed in the “LIMITATIONS” section.
The drop in lift and the continual increase in drag beyond the critical point (stall angle of attack) are primarily caused by flow separation over the airfoil’s upper surface. However, the “inviscid compressible Euler solver” employed by the app assumes inviscid flow, meaning it does not account for viscous effects like drag, flow separation and stall.
This limitation becomes evident when the AOA exceeds the critical point, causing a drop in lift and a continuous increase in drag due to flow separation over the airfoil’s upper surface, which the Euler solver cannot accurately simulate.
The value of calculated drag (cd) of the Euler simulation is caused by the numeric discretization errors and should not be considered as the real physical drag.
CONCLUSION
- The Airfoil Design App accurately predicts coefficients of pressure and closely aligns with test data and NASA’s CFD codes for pressure distributions along the airfoil surface.
- The app is highly capable of accurately predicting lift and drag forces in an inviscid flow regime up to the point of stall.
- The app’s accuracy is limited to scenarios where viscous effects (e.g., drag, flow separation, stall) play a minimal role due to its solver’s limitations.
- In cases where viscous effects become significant, additional analyses are needed for accurate predictions.
- The app’s limitations stem from its chosen computational methods, which cannot accurately capture complex phenomena like drag and stall caused by flow separation.
- Caution should be exercised when interpreting Cl vs. AOA and Cd vs. AOA graphs in situations involving significant viscous effects, and the app’s limitations and assumptions should be considered.