Overview
The primary objective of the initial module is to provide students with a comprehensive understanding of the complex principles governing aerodynamics, particularly focusing on the behavior of airfoils. This module is designed to delve into the relationship between the Angle of Attack (AOA) and fundamental aerodynamic coefficients of lift and drag.
By assuming a specific Mach number and other flow conditions around the NACA airfoil, students will gain insight into how changes in AOA influence these critical aerodynamic parameters. To achieve this objective, two distinct airfoil profiles were selected: the symmetric NACA0012 and the cambered NACA2412. The CAD models of these airfoil geometries were engineered using SolidWorks, and simulations were conducted using Wind Tunnel, Airfoil Design and SimScale. These simulations aimed to analyze the airflow characteristics around the chosen airfoil profiles under varying conditions of Angle of Attack. To validate the accuracy of the simulation results, comprehensive comparisons were made with experimental data obtained from reputable research papers. Additionally, internal consistency checks were performed by comparing the results of different simulation runs, further bolstering the confidence in the obtained results.
Essential Theory
Geometry
In the context of an airfoil diagram provided below, the essential terminology associated with airfoil geometry are:
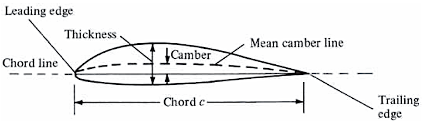
Airfoil Nomenclature
- Chord Length: Distance from leading to trailing edge.
- Camber: The maximum distance between the mean camber line and the chord line, measured perpendicularly (symmetric or cambered).
- Thickness Distribution: Vertical distance between the upper and lower surfaces, also perpendicular to the chord line.
- Leading Edge Radius: Curvature at the front of the airfoil.
- Trailing Edge Thickness: Thickness at the rear of the airfoil.
- Aspect Ratio: Ratio of wingspan to average chord length.
- Sweep Angle: Angle between the airfoil chord line and the direction of the airflow.
- Mean camber line: Signifies the midpoint between the upper and lower surfaces of the airfoil, measured perpendicular to itself.
In crafting standard NACA airfoils, the shape is determined by defining the mean camber line and then surrounding it with a symmetrical thickness distribution. These airfoils are categorized using a structured numbering system. For example, the NACA 2412 airfoil features 2% camber at 40% chord with 12% thickness. An airfoil with no camber, aligning its camber line with the chord line, is termed a symmetric airfoil, exemplified by the NACA0012 model.
Aerodynamic Behavior
Understanding how an airfoil behaves aerodynamically relies heavily on analyzing its pressure and velocity distributions.
Pressure distribution illustrates how air pressure changes across the airfoil’s surface as it moves through the air, which is governed by Bernoulli’s principle, which states that as the speed of a fluid (like air) increases, its pressure decreases, and vice versa. As a result, the upper surface of the airfoil, where airflow velocity is higher, experiences lower pressure. Whereas, on the lower surface, where airflow velocity is lower, pressure is higher, leading to the formation of a “pressure” side with elevated pressure levels.
Velocity distribution, on the other hand, refers to how airflow speed changes along the surface of the airfoil. At the airfoil’s leading edge, airflow velocity is initially low. As the airfoil curves, airflow accelerates, reaching its maximum velocity around the midpoint of the upper surface. As the airfoil tapers towards the trailing edge, airflow velocity decreases again, returning to lower levels by the time it reaches the trailing edge.
Lift & Drag Generation and Trends
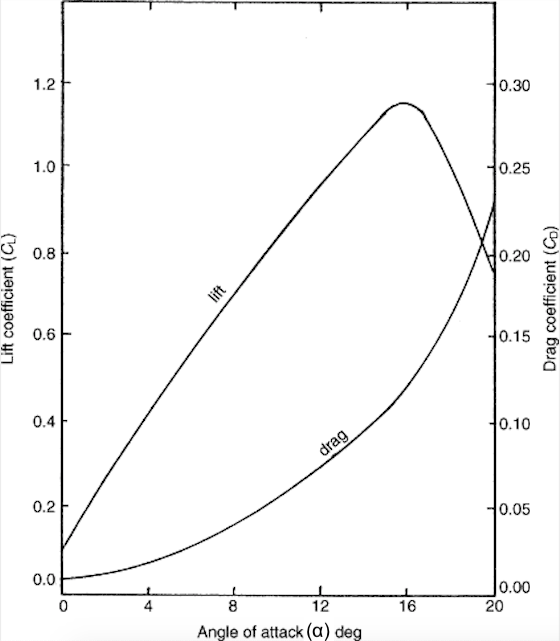
Lift, the upward force generated by the difference in pressure between the upper and lower surfaces of the airfoil, is crucial for flight. Typically, the point of maximum lift coincides with the point of maximum curvature on the upper surface, known as the “stagnation point.” Increasing the angle of attack enhances lift to a certain threshold, beyond which flow separation may occur, resulting in a stall.
The lift coefficient varies with the angle of attack for an airfoil. At low-to- moderate angles of attack, the lift coefficient changes linearly with the angle of attack, represented by a slope, known as the lift slope. During this phase, the flow remains attached to the airfoil’s surface.
However, as the angle of attack increases, the flow tends to detach from the airfoil’s top surface, leading to a large wake of stagnant air behind the airfoil. Within this separated region, the flow recirculates, with some moving in the opposite direction of the freestream—a phenomenon known as reversed flow. Viscous effects contribute to this separated flow at high angles of attack, resulting in a sharp decline in lift and a significant increase in drag, indicating a stall. The maximum lift coefficient, clmax, reached just before the stall, determines the stalling speed of an aircraft; a higher clmax corresponds to a lower stalling speed.
Flow Simulations
Consult the tutorials ‘Flow Around an Airfoil (NACA0012 )‘ and ‘Flow Around an Airfoil (NACA2412)’ to grasp the concepts outlined below.
In the Wind Tunnel App, various airfoil models underwent testing to analyze flow characteristics, particularly focusing on pressure and velocity distributions. While visualizations of the wake and separation regions were obtained, conducting a detailed quantitative analysis proved challenging.
A notable feature of the Wind Tunnel App was its ability to visualize wake and separation regions. These visual representations offered insights into the disturbed airflow downstream of the airfoil (the wake) and areas where airflow detached from the airfoil surface (separation regions). Understanding these phenomena was crucial for aerodynamic comprehension, aiding in addressing issues like stall and enhancing airfoil design.
Moreover, the Wind Tunnel App incorporated smoke flow visualization, a potent tool allowing for the tracing of airflow paths over the airfoil. This technique facilitated the identification of flow patterns, separation points, and turbulence regions, augmenting the qualitative analysis with additional detail.
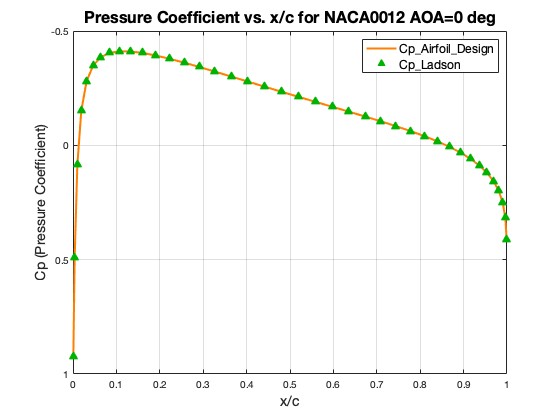
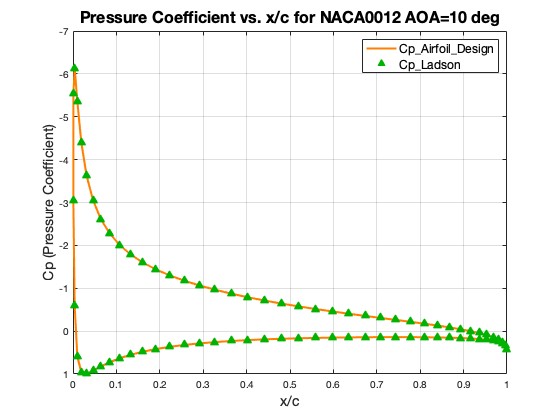
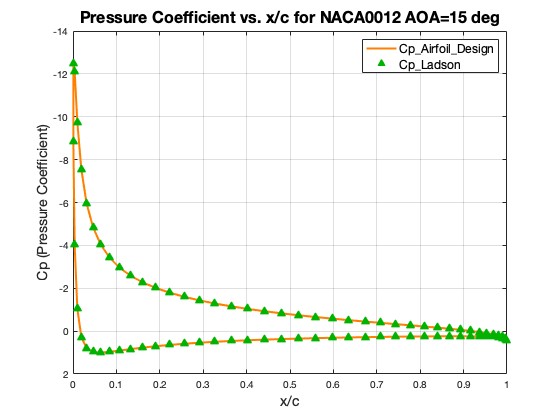
Despite the qualitative insights gained from these visualizations, the Wind Tunnel App encountered limitations in conducting a comprehensive quantitative analysis. This prompted the utilization of the Airfoil Design App, known for its accuracy in predicting pressure coefficients, which closely matched experimental data and NASA’s Computational Fluid Dynamics (CFD) codes.
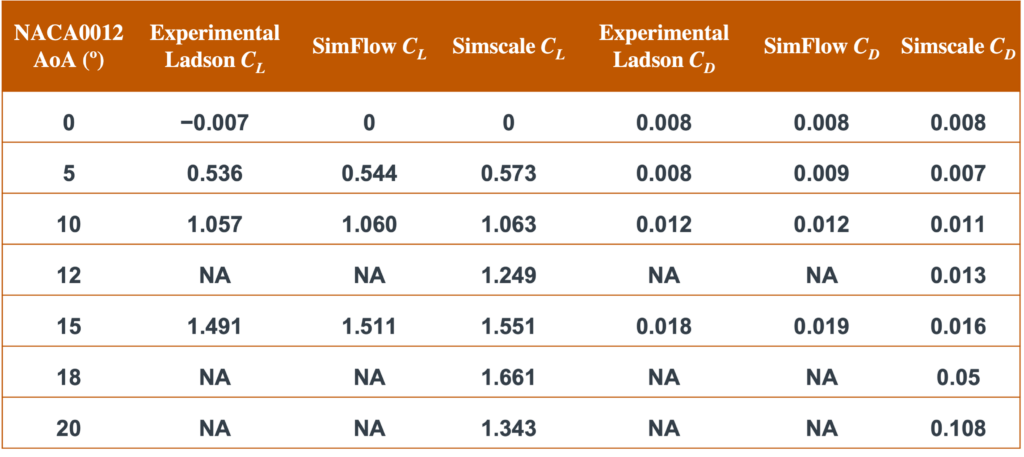
However, the subsequent analysis revealed the desired trends for the value of coefficient of lift for the values of angle of attack until the critical angle of attack, and unexpected trends in lift and drag coefficient values extending beyond the anticipated stall point, indicating potential inaccuracies in the results obtained.
The observed decrease in lift and continual increase in drag beyond the stall angle of attack were attributed to flow separation over the airfoil’s upper surface. Notably, the employed inviscid compressible Euler solver neglected viscous effects like drag, flow separation, and stall, as discussed in the Airfoil Design Limitations section. Consequently, the calculated drag (Cd) from the Euler simulation was acknowledged to be a result of numerical discretization errors and did not accurately represent physical drag.
While the inviscid flow model in the Airfoil Design App allowed for the prediction of lift slope (a0) up to Clmax, it proved inadequate for calculating Clmax, a complex viscous flow problem. To address this limitation, simulations were conducted using Simscale, incorporating viscous effects through the K-Epsilon turbulence model and incompressible Newtonian flow. The Simscale simulations focused on two types of airfoils – the symmetric NACA0012 and the cambered NACA2412. For symmetric airfoils like NACA0012.
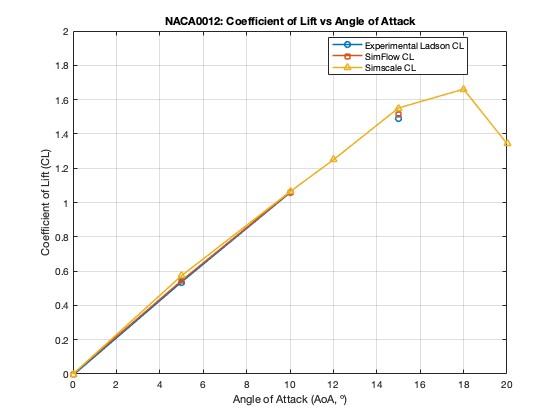
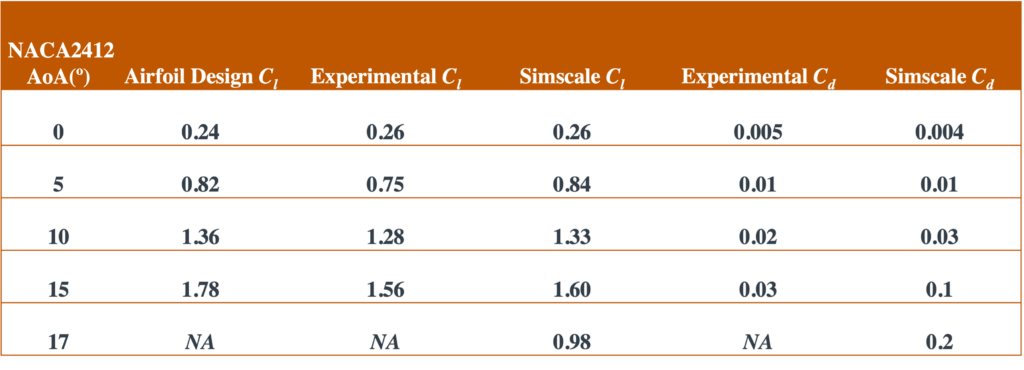
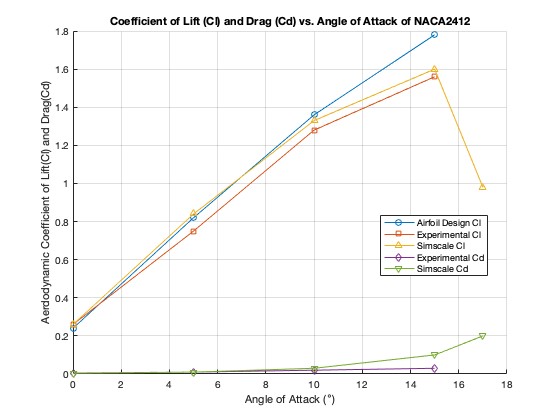
Comparison of simulation results with test data from various sources confirmed validation for lift and moment coefficients for the NACA 2412 airfoil, as depicted in the figures.
NOTE: Refer to the tutorial to view the details of the simulation set-up.
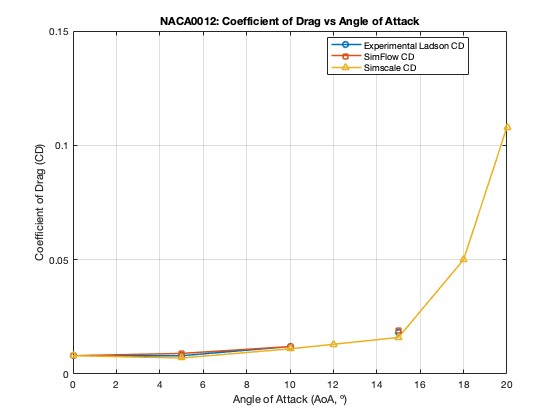
Validation Results
Here’s a comparison of the simulation results with what’s in the literature, based on the flow simulation conditions given in the tutorials. This helps validate our findings!
NACA0012
NACA2412
REFERENCES
[4] Zhao, P., Gao, X., Zhao, B., Liu, C., Wu, J., and Deng, Z., 2023, “Machine Learning Assisted Prediction of Airfoil Lift-to-Drag Characteristics for Mars Helicopter,” Aerospace, 10(7), p. 614.
[7] Kojima, H., Toda, K., and Yamamoto, M., 2002, “COMPUTATION OF AERODYNAMIC PERFORMANCE OF AIRFOIL WITH SURFACE ROUGHNESS,” Elsevier eBooks, pp. 629–636.